2023 English local election
The 2023 East Suffolk District Council election took place on 4 May 2023 to elect members of East Suffolk District Council in Suffolk, England.[1] This was held on the same day as other local elections. All 55 seats on the council were up for election.
Summary
Prior to the election the council was under Conservative majority control.[2] The Conservative leader of the council, Steve Gallant, did not stand for re-election in 2023.[3]
Following the results of the election, the Conservatives lost control of the council to no overall control, with the three opposition parties making gains at their expense. A coalition of the Greens, Liberal Democrats and the independent councillor subsequently formed. On 24 May 2023, at the inaugural council meeting for the 2023-2024 term, Caroline Topping, a Green Party councillor for Beccles & Worlingham ward, was elected as leader of the council, with Liberal Democrat leader David Beavan becoming deputy leader. The new administration holds 28 out of 55 seats and has a majority of 1.[4][5]
Overall results
The overall results were as follows:[6]
| 2023 East Suffolk District Council election |
| Party | Candidates | Seats | Gains | Losses | Net gain/loss | Seats % | Votes % | Votes | +/− |
| | Green | 37 | 16 | 12 | 0 |  12 12 | 29.1 | 26.8 | 35,804 | +4.8 |
| | Conservative | 55 | 15 | 0 | 24 |  24 24 | 27.3 | 37.0 | 49,399 | –1.2 |
| | Labour | 37 | 12 | 5 | 0 | 5 | 21.8 | 19.7 | 26,279 | +2.7 |
| | Liberal Democrats | 25 | 11 | 8 | 0 | 8 | 20.0 | 15.8 | 21,106 | +4.4 |
| | Independent | 3 | 1 | 0 | 1 | 1 | 1.8 | 0.5 | 641 | –4.3 |
| | Communist | 2 | 0 | 0 | 0 |  | 0.0 | 0.2 | 257 | N/A |
| | Heritage | 1 | 0 | 0 | 0 | | 0.0 | <0.1 | 56 | N/A |
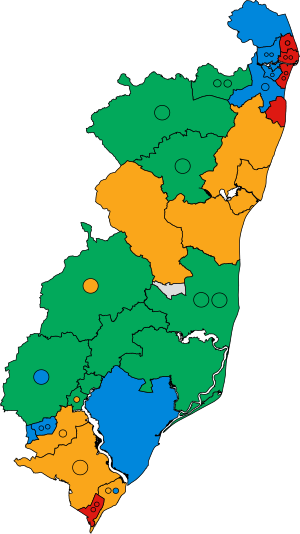
Ward results
The Statement of Persons Nominated, which details the candidates standing in each ward, was released by East Suffolk District Council following the close of nominations on 4 April 2023.[7] The results for each ward were as follows, with an asterisk (*) indicating an incumbent councillor standing for re-election:[8][9]
Aldeburgh & Leiston
Aldeburgh & Leiston (3 seats) | Party | Candidate | Votes | % | ±% |
| | Green | Tom Daly* | 2,086 | 54.8 | +35.7 |
| | Green | Katie Graham | 1,961 | 51.5 | +36.1 |
| | Green | Sarah Whitelock | 1,896 | 49.8 | +36.4 |
| | Conservative | Jocelyn Bond | 1,275 | 33.5 | +2.1 |
| | Conservative | Tony Cooper* | 1,233 | 32.4 | –1.3 |
| | Conservative | Andrew Reid | 1,089 | 28.6 | –2.1 |
| | Labour | David Grugeon | 599 | 15.7 | –6.6 |
| | Labour | Ray Breach | 561 | 14.7 | –6.1 |
| Turnout | 3,808 | 38.6 | +0.4 |
| Registered electors | 9,876 | | |
| | Green gain from Conservative |
| | Green gain from Conservative |
| | Green gain from Independent |
Tom Daly previously won a seat in a by-election, however the seat is shown as a gain as compared to the 2019 election.
Beccles & Worlingham
Beccles & Worlingham (3 seats) | Party | Candidate | Votes | % | ±% |
| | Green | Caroline Topping* | 2,792 | 67.7 | +2.0 |
| | Green | Sarah Plummer* | 2,673 | 64.8 | –7.6 |
| | Green | Sheryl Rumble | 2,471 | 59.9 | –5.5 |
| | Conservative | Trish Mortimer* | 851 | 20.6 | –4.0 |
| | Conservative | Bernard Reader | 806 | 19.6 | –1.5 |
| | Conservative | May Reader | 784 | 19.0 | +3.0 |
| | Labour | Sam Hunt | 583 | 14.1 | +8.9 |
| | Labour | Tarek Lahin | 531 | 12.9 | +7.7 |
| | Labour | Tony Burgess | 487 | 11.8 | N/A |
| Turnout | 4,122 | 35.0 | –9.1 |
| Registered electors | 11,768 | | |
| | Green hold |
| | Green hold |
| | Green hold |
Bungay & Wainford
Bungay & Wainford (2 seats) | Party | Candidate | Votes | % | ±% |
| | Green | Toby Hammond | 1,682 | 59.0 | +25.0 |
| | Green | Anthony Speca | 1,569 | 55.1 | +27.3 |
| | Conservative | Judy Cloke* | 812 | 28.5 | –14.2 |
| | Conservative | Mark Bee | 776 | 27.2 | –15.9 |
| | Labour | Tim Mobbs | 294 | 10.3 | –5.0 |
| | Labour | Chris Saddler | 229 | 8.0 | –5.8 |
| | Independent | Natalie Carlile | 169 | 5.9 | N/A |
| Turnout | 2,850 | 41.5 | +5.5 |
| Registered electors | 6,868 | | |
| | Green gain from Conservative |
| | Green gain from Conservative |
Carlford & Fynn Valley
Carlford & Fynn Valley (2 seats) | Party | Candidate | Votes | % | ±% |
| | Green | Dan Clery | 1,388 | 50.6 | +23.5 |
| | Conservative | Colin Hedgley* | 1,272 | 46.3 | –4.2 |
| | Green | Nigel Hiley | 1,263 | 46.0 | +26.2 |
| | Conservative | Ben Coupe | 1,257 | 45.8 | –4.1 |
| Turnout | 2,745 | 40.7 | +1.8 |
| Registered electors | 6,745 | | |
| | Green gain from Conservative |
| | Conservative hold |
Carlton & Whitton
Carlton & Whitton (2 seats) | Party | Candidate | Votes | % | ±% |
| | Conservative | Jamie Starling | 904 | 45.5 | +13.7 |
| | Conservative | Jenny Ceresa* | 879 | 44.3 | +14.2 |
| | Labour | Charlotte Barker | 769 | 38.7 | +12.6 |
| | Labour | Sonia Barker | 758 | 38.2 | +16.9 |
| | Green | Anna Hammond | 191 | 9.6 | –2.7 |
| | Green | Daniel Keates | 143 | 7.2 | N/A |
| | Liberal Democrats | John Mercer | 135 | 6.8 | –0.7 |
| | Liberal Democrats | Dave O'Neill | 90 | 4.5 | N/A |
| Turnout | 1,985 | 25.4 | –3.2 |
| Registered electors | 7,802 | | |
| | Conservative hold |
| | Conservative hold |
Carlton Colville
Carlton Colville (2 seats) | Party | Candidate | Votes | % | ±% |
| | Conservative | Craig Rivett* | 787 | 41.7 | +8.1 |
| | Conservative | Myles Scrancher | 696 | 36.9 | –0.4 |
| | Liberal Democrats | Adam Robertson | 658 | 34.9 | +5.8 |
| | Liberal Democrats | Chris Thomas | 604 | 32.0 | +2.9 |
| | Labour | Christian Newsome | 473 | 25.1 | +6.8 |
| | Labour | Jack Smith | 438 | 23.2 | +7.4 |
| Turnout | 1,887 | 25.4 | –2.8 |
| Registered electors | 7,439 | | |
| | Conservative hold |
| | Conservative hold |
Deben
Deben | Party | Candidate | Votes | % | ±% |
| | Conservative | James Mallinder* | 773 | 51.5 | +3.9 |
| | Green | Richard Noble | 729 | 48.5 | +29.6 |
| Majority | 44 | 3.0 | –23.6 |
| Turnout | 1,517 | 40.5 | –0.5 |
| Registered electors | 3,742 | | |
| | Conservative hold | Swing | 12.9 | |
Eastern Felixstowe
Eastern Felixstowe | Party | Candidate | Votes | % | ±% |
| | Liberal Democrats | Seamus Bennett | 2,288 | 50.2 | +19.4 |
| | Liberal Democrats | Jan Candy | 1,838 | 40.3 | +15.8 |
| | Conservative | Mark Jepson* | 1,722 | 37.8 | +0.2 |
| | Conservative | Steve Wiles* | 1,676 | 36.8 | –3.2 |
| | Liberal Democrats | David Underwood | 1,567 | 34.4 | +10.9 |
| | Conservative | Anthony Malster | 1,521 | 33.4 | –10.4 |
| | Labour | David Rowe | 1,115 | 24.5 | +3.1 |
| | Communist | Hagar Babbington | 154 | 3.4 | N/A |
| Turnout | 4,559 | 42.9 | +3.7 |
| Registered electors | 10,638 | | |
| | Liberal Democrats gain from Conservative |
| | Liberal Democrats gain from Conservative |
| | Conservative hold |
Framlingham
Framlingham (2 seats) | Party | Candidate | Votes | % | ±% |
| | Green | Vince Langdon-Morris | 1,652 | 57.9 | +23.6 |
| | Liberal Democrats | Owen Grey | 1,283 | 45.0 | +16.1 |
| | Conservative | Tom Faulkner | 1,051 | 36.9 | –2.5 |
| | Conservative | Maurice Cook* | 1,046 | 36.7 | –5.3 |
| Turnout | 2,851 | 41.0 | +3.3 |
| Registered electors | 6,961 | | |
| | Green gain from Conservative |
| | Liberal Democrats gain from Conservative |
Gunton & St Margarets
Gunton & St Margarets (2 seats) | Party | Candidate | Votes | % | ±% |
| | Labour | George King | 1,020 | 44.6 | +19.9 |
| | Labour | Graham Parker | 960 | 42.0 | +21.6 |
| | Conservative | Linda Coulam* | 933 | 40.8 | +10.8 |
| | Conservative | Ryan Harvey | 801 | 35.1 | +1.1 |
| | Green | Alison Ballantyne | 208 | 9.1 | –14.3 |
| | Green | Kerri Edmondson | 198 | 8.7 | N/A |
| | Liberal Democrats | Fiona Shreeve | 121 | 5.3 | N/A |
| | Liberal Democrats | John Shreeve | 94 | 4.1 | N/A |
| Turnout | 2,285 | 30.0 | ±0.0 |
| Registered electors | 7,626 | | |
| | Labour gain from Conservative |
| | Labour gain from Conservative |
Halesworth & Blything
Halesworth & Blything (2 seats) | Party | Candidate | Votes | % | ±% |
| | Green | Beth Keys-Holloway | 1,756 | 65.6 | +23.0 |
| | Green | Geoffrey Wakeling | 1,702 | 63.6 | N/A |
| | Conservative | Alison Cackett* | 760 | 28.4 | –15.0 |
| | Conservative | Graham Catchpole | 629 | 23.5 | –19.3 |
| | Labour | John Murray | 254 | 9.5 | –14.2 |
| Turnout | 2,675 | 40.2 | +3.4 |
| Registered electors | 6,647 | | |
| | Green gain from Conservative |
| | Green gain from Conservative |
Harbour & Normanston
Harbour & Normanston (3 seats) | Party | Candidate | Votes | % | ±% |
| | Labour | Janet Craig* | 1,117 | 55.2 | +19.1 |
| | Labour | Keith Patience* | 1,109 | 54.8 | +17.4 |
| | Labour | Tess Gandy* | 1,088 | 53.8 | +18.4 |
| | Conservative | David Coulam | 560 | 27.7 | +14.2 |
| | Conservative | Deanna Law | 516 | 25.5 | +12.7 |
| | Conservative | Vince Rule | 473 | 23.4 | +11.8 |
| | Green | Alice Eastaugh | 309 | 15.3 | –0.7 |
| | Green | Phillip Love | 282 | 13.9 | N/A |
| | Green | Debbie Ray | 272 | 13.5 | N/A |
| Turnout | 2,022 | 18.1 | –4.3 |
| Registered electors | 11,176 | | |
| | Labour hold |
| | Labour hold |
| | Labour hold |
Kelsale & Yoxford
Kelsale & Yoxford | Party | Candidate | Votes | % | ±% |
| | Liberal Democrats | Julia Ewart | 752 | 54.4 | +31.4 |
| | Conservative | Alexander Nicoll | 356 | 25.8 | –18.8 |
| | Labour | John Clark | 274 | 19.8 | N/A |
| Majority | 396 | 28.6 | N/A |
| Turnout | 1,397 | 43.9 | +5.2 |
| Registered electors | 3,179 | | |
| | Liberal Democrats gain from Conservative | Swing | 25.1 | |
Kesgrave
Kesgrave (3 seats) | Party | Candidate | Votes | % | ±% |
| | Conservative | Debbie McCallum* | 1,958 | 58.6 | –1.3 |
| | Conservative | Stuart Lawson* | 1,367 | 40.9 | –8.2 |
| | Conservative | Geoff Lynch* | 1,261 | 37.7 | –9.6 |
| | Liberal Democrats | Brad Clements | 1,207 | 36.1 | +12.6 |
| | Labour | Lesley Bensley | 972 | 29.1 | +12.8 |
| | Green | Marcin Burcon | 905 | 27.1 | +5.2 |
| | Liberal Democrats | Sally Neal | 862 | 25.8 | N/A |
| Turnout | 3,342 | 29.9 | +0.6 |
| Registered electors | 11,161 | | |
| | Conservative hold |
| | Conservative hold |
| | Conservative hold |
Kessingland
Kessingland | Party | Candidate | Votes | % | ±% |
| | Labour | Alan Green | 398 | 37.0 | +4.9 |
| | Conservative | Letitia Smith* | 359 | 33.4 | –1.0 |
| | Green | Jon Coxon | 318 | 29.6 | +8.3 |
| Majority | 39 | 3.6 | N/A |
| Turnout | 1,086 | 31.2 | +1.8 |
| Registered electors | 3,485 | | |
| | Labour gain from Conservative | Swing | 2.9 | |
Kirkley & Pakefield
Kirkley & Pakefield (3 seats) | Party | Candidate | Votes | % | ±% |
| | Labour | Louise Gooch* | 1,422 | 52.0 | +15.8 |
| | Labour | Peter Byatt* | 1,421 | 52.0 | +15.6 |
| | Labour | Malcolm Pitchers* | 1,239 | 45.4 | +14.5 |
| | Conservative | David Bromley | 866 | 31.7 | +3.0 |
| | Conservative | June Ford | 848 | 31.0 | +3.9 |
| | Conservative | Jean Bowry | 788 | 28.8 | +4.1 |
| | Green | Annette Abbott | 474 | 17.3 | –4.0 |
| | Green | Alan Barnes | 406 | 14.9 | N/A |
| | Green | Christopher Hart | 323 | 11.8 | N/A |
| Turnout | 2,732 | 26.2 | –1.5 |
| Registered electors | 10,441 | | |
| | Labour hold |
| | Labour hold |
| | Labour hold |
Lothingland
Lothingland | Party | Candidate | Votes | % | ±% |
| | Conservative | Paul Ashdown* | 434 | 47.1 | –1.0 |
| | Labour | Thomas Leveritt | 318 | 34.5 | +8.7 |
| | Green | Rosemary Brambley | 111 | 12.0 | –6.5 |
| | Liberal Democrats | Susan Groome | 59 | 6.4 | –1.1 |
| Majority | 116 | 12.6 | –9.7 |
| Turnout | 925 | 31.6 | –0.9 |
| Registered electors | 2,926 | | |
| | Conservative hold | Swing | 4.9 | |
Martlesham & Purdis Farm
Martlesham & Purdis Farm (2 seats) | Party | Candidate | Votes | % | ±% |
| | Liberal Democrats | Edward Thompson* | 1,229 | 54.0 | +9.5 |
| | Liberal Democrats | Mark Packard | 1,094 | 48.0 | N/A |
| | Conservative | Chris Blundell* | 1,076 | 47.2 | –9.1 |
| | Conservative | Guy Jenkinson | 930 | 40.8 | –1.9 |
| Turnout | 2,278 | 37.2 | +3.1 |
| Registered electors | 6,121 | | |
| | Liberal Democrats hold |
| | Liberal Democrats gain from Conservative |
Melton
Melton | Party | Candidate | Votes | % | ±% |
| | Green | Rachel Smith-Lyte* | 890 | 52.1 | –7.8 |
| | Conservative | Alan Porter | 641 | 37.5 | –2.6 |
| | Labour | Katherine Bicknell | 178 | 10.4 | N/A |
| Majority | 249 | 14.6 | –5.2 |
| Turnout | 1,716 | 47.7 | +1.6 |
| Registered electors | 3,594 | | |
| | Green hold | Swing | 2.6 | |
Orwell & Villages
Orwell & Villages (2 seats) | Party | Candidate | Votes | % | ±% |
| | Liberal Democrats | Mike Ninnmey | 1,736 | 62.5 | N/A |
| | Liberal Democrats | Lee Reeves | 1,492 | 53.7 | N/A |
| | Conservative | Mick Richardson | 1,004 | 36.2 | –2.6 |
| | Conservative | Patti Mulcahy | 858 | 30.9 | –6.7 |
| Turnout | 2,776 | 35.9 | –3.0 |
| Registered electors | 7,730 | | |
| | Liberal Democrats gain from Conservative |
| | Liberal Democrats gain from Conservative |
Oulton Broad
Oulton Broad (3 seats) | Party | Candidate | Votes | % | ±% |
| | Conservative | Edward Back* | 1,403 | 48.9 | +9.2 |
| | Conservative | Keith Robinson* | 1,329 | 46.3 | +9.3 |
| | Conservative | Andrée Gee* | 1,304 | 45.5 | +8.9 |
| | Labour | Bob Groome | 989 | 34.5 | +11.5 |
| | Labour | Jen Jones | 985 | 34.3 | +9.2 |
| | Labour | Paul Page | 886 | 30.9 | +9.9 |
| | Green | Andrew Eastnaugh | 321 | 11.2 | –0.8 |
| | Green | Susan Steward | 294 | 10.2 | –1.3 |
| | Green | Jesse Timberlake | 286 | 10.0 | N/A |
| | Liberal Democrats | Simon MacDowall | 163 | 5.7 | –3.8 |
| | Liberal Democrats | Andrew Turner | 142 | 4.9 | N/A |
| | Liberal Democrats | Timothy Sutton-Day | 137 | 4.8 | N/A |
| Turnout | 2,869 | 26.4 | –2.3 |
| Registered electors | 10,852 | | |
| | Conservative hold |
| | Conservative hold |
| | Conservative hold |
Rendlesham & Orford
Rendlesham & Orford | Party | Candidate | Votes | % | ±% |
| | Green | Tim Wilson | 842 | 58.1 | +36.9 |
| | Conservative | Ray Herring* | 550 | 38.0 | –13.9 |
| | Heritage | Martin Foxton | 56 | 3.9 | N/A |
| Majority | 292 | 20.1 | N/A |
| Turnout | 1,455 | 37.8 | +4.2 |
| Registered electors | 3,841 | | |
| | Green gain from Conservative | Swing | 24.5 | |
Rushmere St Andrew
Rushmere St Andrew | Party | Candidate | Votes | % | ±% |
| | Conservative | Deborah Dean | 582 | 46.8 | –11.1 |
| | Labour | Alistair Dick | 405 | 32.6 | +12.5 |
| | Green | Stewart Belfield | 256 | 20.6 | –1.4 |
| Majority | 177 | 14.2 | –21.7 |
| Turnout | 1,252 | 35.4 | +3.0 |
| Registered electors | 3,539 | | |
| | Conservative hold | Swing | 8.6 | |
Saxmundham
Saxmundham | Party | Candidate | Votes | % | ±% |
| | Independent | John Fisher* | 396 | 34.5 | –11.5 |
| | Liberal Democrats | James Sandbach | 320 | 27.9 | +1.9 |
| | Conservative | Phillip Dunnett | 222 | 19.3 | –7.9 |
| | Labour | Mark Turner | 210 | 18.3 | N/A |
| Majority | 76 | 6.6 | –12.2 |
| Turnout | 1,156 | 33.3 | –0.4 |
| Registered electors | 3,472 | | |
| | Independent hold | Swing | 6.7 | |
Southwold
Southwold | Party | Candidate | Votes | % | ±% |
| | Liberal Democrats | David Bevan* | 1,122 | 72.4 | –8.4 |
| | Conservative | Tony Goldson | 265 | 17.1 | +1.6 |
| | Labour | Stephen Stansfield | 87 | 5.6 | +1.9 |
| | Independent | Kevin Cross | 76 | 4.9 | N/A |
| Majority | 857 | 55.3 | –10.0 |
| Turnout | 1,553 | 48.2 | –8.0 |
| Registered electors | 3,221 | | |
| | Liberal Democrats hold | Swing | 5.0 | |
Western Felixstowe
Western Felixstowe (3 seats) | Party | Candidate | Votes | % | ±% |
| | Labour | Mike Deacon* | 1,204 | 49.8 | +7.5 |
| | Labour | Amanda Folley | 965 | 39.9 | +6.7 |
| | Labour | Rosie Smithson | 916 | 37.9 | +8.3 |
| | Conservative | Stuart Bird* | 848 | 35.1 | –1.3 |
| | Conservative | Tracey Green* | 829 | 34.3 | –1.0 |
| | Conservative | Steve Bain | 815 | 33.7 | +1.3 |
| | Green | Richard Keyworth | 456 | 18.9 | –1.9 |
| | Green | Angus Thody | 364 | 15.1 | –4.4 |
| | Communist | Mark Jones | 103 | 4.3 | N/A |
| Turnout | 2,416 | 27.6 | –0.4 |
| Registered electors | 8,759 | | |
| | Labour hold |
| | Labour gain from Conservative |
| | Labour gain from Conservative |
Wickham Market
Wickham Market | Party | Candidate | Votes | % | ±% |
| | Green | Sally Noble | 930 | 62.6 | +45.3 |
| | Conservative | Carol Poulter* | 555 | 37.4 | –9.7 |
| Majority | 375 | 25.2 | N/A |
| Turnout | 1,493 | 38.3 | +0.6 |
| Registered electors | 3,895 | | |
| | Green gain from Conservative | Swing | 27.5 | |
Woodbridge
Woodbridge | Party | Candidate | Votes | % | ±% |
| | Green | Stephen Molyneux | 1,404 | 48.9 | N/A |
| | Liberal Democrats | Kay Yule* | 1,220 | 42.5 | –12.9 |
| | Labour | Paul Richards | 864 | 30.1 | –6.8 |
| | Conservative | Geoff Holdcroft | 845 | 29.4 | –7.5 |
| | Conservative | Stephen Attwell | 776 | 27.0 | –11.1 |
| Turnout | 2,870 | 44.9 | +1.2 |
| Registered electors | 6,398 | | |
| | Green gain from Conservative |
| | Liberal Democrats hold |
Wrentham, Wangford & Westleton
Wrentham, Wangford & Westleton | Party | Candidate | Votes | % | ±% |
| | Liberal Democrats | Paul Ashton | 893 | 59.5 | +32.8 |
| | Conservative | Norman Brooks* | 448 | 29.8 | –5.6 |
| | Labour | Jane Murray | 161 | 10.7 | –3.6 |
| Majority | 445 | 29.7 | N/A |
| Turnout | 1,518 | 44.3 | +5.1 |
| Registered electors | 3,428 | | |
| | Liberal Democrats gain from Conservative | Swing | 19.2 | |
References
- ^ "NOTICE OF ELECTION" (PDF). East Suffolk District Council. Retrieved 4 April 2023.
- ^ "Which Suffolk councils are holding elections in May 2023?". Paul Geater. East Anglian Daily Times. 16 March 2023. Retrieved 4 April 2023.
- ^ Geater, Paul (5 April 2023). "Who is standing for election in East Suffolk on May 4?". East Anglian Daily Times. Retrieved 4 January 2024.
- ^ "East Suffolk to be run by Green/Lib Dem coalition". East Anglian Daily Times. 18 May 2023. Retrieved 4 January 2024.
- ^ "New Leader for East Suffolk Council". East Suffolk Council. Retrieved 24 May 2023.
- ^ "Local elections 2023: full council results for England". The Guardian. 9 May 2023. Retrieved 4 January 2024.
- ^ "STATEMENT OF PERSONS NOMINATED, NOTICE OF POLL & SITUATION OF POLLING STATIONS" (PDF). East Suffolk District Council. Retrieved 4 April 2023.
- ^ "Declaration of result of poll" (PDF). East Suffolk Council. Retrieved 4 January 2024.
- ^ "Councillors". East Suffolk Council. Archived from the original on 1 April 2023. Retrieved 4 January 2024.


 12
12  24
24 

 Council elections in Suffolk


